
What is R? - The Statistical Computing base for data science

Introduction of R for data science
R is a statistical programming tool that’s uniquely equipped to handle data, and lots of it.
Wrangling mass amounts of information and producing publication-ready graphics and visualizations is easy with R. So are all sorts of data analysis, mining, and modeling tasks.
Because it was first designed by statisticians for statistical purposes, R is exceptionally well-suited to data science, an important field in today’s world.
While R’s core function is statistical analysis and graphics, its use extends past these and into AI, machine learning, financial analysis, and more.
Consistently ranked as one of the world’s most popular programming languages, not to mention one that commands high salaries, R has been around since the early 1990s and is still going strong.
Read on to learn more about the R programming language including its history, who uses it, and possible career paths with R skills under your belt.
What is R?
R is a statistical computing and graphics system. This system is comprised of two parts: the R language itself (which is what most people mean when they talk about R) and a run-time environment.
R is an interpreted language, which means that users access its functions through a command-line interpreter.
Unlike languages such as Python and Java, R is not a general-purpose programming language. Instead, it’s considered a domain-specific language (DSL), meaning its functions and use are designed for a specific area of use or domain.
In R’s case, that’s statistical computing and analysis. By extension, R is commonly used for all manner of data science tasks.
R is equipped with a large set of functions that enable data visualizations, so users can analyze data, model it as required, and then create graphics. In addition to the language’s in-built graphical functions, there are numerous add-ons or modules that facilitate this.
Is R a Popular Programming Language?
R is a popular programming language, especially in certain fields such as data science, academic research, and statistics.
At the time of writing (March 2022), R held 11th place on the TIOBE Index, and in August 2020, R was at 8th place. Updated monthly, the TIOBE Index is a good indicator of a programming language’s popularity.
There are 50 languages listed in the index, and more than 8000 other programming languages in known existence, so it’s safe to say that R is popular!
In May 2020, R briefly lost its top-twenty spot in the TIOBE Index, leading many to speculate that the language’s jump from academic research to commercial use was quickly supplanted by Python. However, this lull in popularity didn’t last long and as TechRepublic reported, by July of the same year, R was in the top ten.
R is the language of choice for statistical engineers and statistical research. And universities around the world use R to aid their research work in numerous fields.
“R’s success is an example of the power of an academia-supported community to elevate a language beyond its expected threshold.” - Stephen O'Grady, RedMonk Analyst
Many people think R’s jump to top-ten popularity in 2020 was down to the language’s increased use in Covid-19 research. When there’s a lot of data to wrangle, R is the ideal tool—just one reason why the language is still popular today, nearly 30 years after its inception.
When was R created?
R was created in the early 1990s by University of Auckland statisticians Ross Ihaka and Robert Gentleman.
Ihaka and Gentleman, both then statistics professors at the New Zealand university, saw what Ihaka called a “common need for a better software environment” in their computer science laboratories. This realization prompted the pair to begin developing R, an implementation of the earlier S programming language.
Although the professors started working on R in the early 90s, version 1.0.0 wasn’t officially released until February 2000.
What does R’s name mean?
The R language got its name for two reasons: because R is the first letter in the inventors’ names, and because R is a play on the name of its parent language S, which was originally developed by Bell Telephone Laboratories.
R and S and Scheme
To fully understand R, it’s helpful to understand S, the main language that informed its development.
The S programming language
S was developed in the mid-1970s by John Chambers and others working for Bell Labs. Its purpose was to offer an interactive approach to statistical computing, one that was user-friendly and made data analysis tasks easier and faster.

In a 2013 interview, Chambers notes that the Bell Labs team wanted people to have “access to the best computational methods that existed, regardless of where they had come from.”
He has also said that the team wanted users to “begin in an interactive environment, where they did not consciously think of themselves as programming. Then as their needs became clearer and their sophistication increased, they should be able to slide gradually into programming.”
S’s general philosophy was much like R’s: to offer a software environment that facilitates computational programming and statistical analysis, one that anyone can learn to use.
Like R, S can also be used to write longer programs centered on statistical tasks. Unlike R, though, S and its later iteration S-PLUS were licensed products, meaning they had to be purchased from a company.
It’s important to note that R is not a distinct language, rather it’s a dialect of S.
Syntax and semantics
Linguists use the terms syntax and semantics to describe elements of natural languages, and computer scientists have adopted these terms for programming languages too.
In computer programming, syntax refers to the rules that dictate a language’s ‘spelling’ and ‘grammar,’ while semantics refers to how a language’s data or commands are presented.
R’s syntax was very similar to that of S in its early years. This made it easy for people using S-PLUS to change to R, which played a key role in R’s eventual popularity in academia. R’s semantics, however, is closer to that of Scheme, a functional programming language.
Is R a low or high-level language?
R is a low-level programming language, which means a few different things, including that it’s closer to a machine language than a natural human language. This, combined with its syntactic quirks have given R a reputation for being difficult to learn.
There’s a trade-off here: R offers power, extensibility, and flexibility in droves but the ‘cost’ is a certain level of complexity.
Beginners heading to the R help pages for assistance are likely to come away even more confused as these are aimed at an experienced audience.
R is not the easiest programming language to learn, but it’s also not as difficult as many would have you believe. DataCamp has been teaching people how to use R for more than a decade and we’ve fine-tuned our methods.
The trick is to focus on the essentials first and then to grow your R skills and knowledge as you progress. If you’d like to try R programming, check out our free Introduction to R course.
How R Has Evolved Over the Years
R has been open-source for most of its lifespan, so there have been big changes to the number of packages available for the language.
The language itself has undergone some changes, too, as we’ve moved from the first version to the most recent, and the fields in which R is used have also expanded. Before covering that in more depth, let’s take a look at a few milestones in R’s history:
A brief history of R
- 1991 - Ross Ihaka and Robert Gentleman begin work on a new dialect of S as a research project for the Department of Statistics at the University of Auckland.
- 1993 - The first announcement of R hits the public via the data archive StatLib and the s-news mailing list.
- 1995 - Fellow statistician Martin Mächler convinces R’s inventors to release the language under a GNU general public license, making R both free to use and open-source.
Ihaka and Gentleman release their seminal paper introducing R to the world.
- 1997 - The R Core Team was formed, this group is the only one with write access to R source code, and they review and enact any suggested changes to the language.
The same year, the Comprehensive R Archive Network (CRAN) was formed. This repository of open-source R software packages, extensions to the language itself, helps professionals with myriad tasks.
- 2000 - R version 1.0.0 was released to the public.
- 2003 - The R Foundation was formed to hold and administer the R software copyright and to provide support for the R language project.
- 2004 - R version 2.0.0 is released.
- 2009 - The R Journal, an open-access journal for statistical computing and research, is established.
- 2013 - R version 3.0.0 is released.
- 2020 - R version 4.0.0 is released.
The R Community
The R community is the people all around the world who use R, contribute to the packages available on the CRAN library, or both.
This community is known for being very active, there are plenty of people running forums about R, blogging about it, and answering questions on Stack Overflow and other places. In addition to all the virtual R resources and support, there are a number of large R conferences that run on a regular basis.


If you want to do something with R and you’re not sure how to begin, there’s a very good chance that there’s a package available to help you. The bustling R community has produced thousands of tools that extend R’s capabilities.
In fact, Microsoft’s Revolution Analytics blog reported that in 2017, there were 10,000 packages listed on CRAN. Some of these packages have risen to prominence in their own right, including the Tidyverse.
The R Tidyverse
There’s a good chance that if you’ve read a bit about R, you’ll have heard of the Tidyverse.
The Tidyverse isn’t a single package, rather it’s a package of individual R packages—very meta, right? These packages are all designed for data science and analytics.
Each tool in the total Tidyverse package is designed to work in conjunction with the others and provide a very clear flow between data science tasks.
The Tidyverse is the brainchild of Hadley Wickham, Chief Scientist at RStudio and co-author of ‘R for Data Science.’ This self-proclaimed “opinionated collection of R packages” has proven popular worldwide and data scientists all over the world now rely on the Tidyverse for their work.
In fact, it’s safe to say that anyone who wants to work with R or with data, in general, these days needs to understand the Tidyverse. You can check it out in DataCamp’s online Introduction to the Tidyverse.
The Rise of Data Science
It would be amiss to chart R’s evolution without mentioning the rise of data science in more detail.
As the world shifted from analog systems to digitization (making existing systems digital) in the late 20th century, data became increasingly valuable. Today, it’s worth more than gold.
Businesses in all sectors and industries need to understand their clients and potential clients to remain competitive, and public organizations can do a better job when they’re equipped with as much information as possible.
All of this data holds plenty of insights that organizations can capitalize on, they just need the right tools.
R is one of those tools, as is Python, SQL, Power Bi, Tableau, and others. To properly understand the information hidden in the data, we need professionals such as data scientists and analysts.
As data science became more important in the modern world, the demand for people with the technical skills to read and interpret data rose accordingly. Today, for example, data science is one of the highest-paid IT roles, with an average salary of over US$100,000 according to Indeed.
Who Uses R?
Plenty of professionals use R in their work, and the language is used across a variety of fields. Before looking at those, let’s review a few possible careers with R skills.
Careers with R
- Data scientist
- Statistical engineer
- Data analyst
- R programmer
- Data architect
- Database administrator
- Geo statistician
- Researcher
- Business intelligence
- Financial analyst
- Machine learning scientist
- Quantitative analyst
- Statistician
- And more…
Fields and industries where R is used
Because it’s powerful and capable of all sorts of data analysis, visualization, and modeling tasks, R is used in a diverse range of industries and sectors. Here are just a few:
Academia
Much like English is the world’s lingua franca, R is the dominant programming language in many academic institutions. Its use isn’t limited to statistics either; many kinds of research need quantitative data including correlational, experimental, and descriptive, and these occur across fields.
Digitalization (the process of embracing data and associated tools) and the rise of big data have touched all fields of study and research, leading to increased use of R in academic settings.
For example, IBM’s Statistical Package for the Social Sciences (SPSS) was once the leading software choice for social sciences. Now, R is the top choice for many reasons:
- R is 100% free for both institutions and students
- R is compatible with all operating systems and data from various file types
- R enables transparent and reproducible research
- R makes creating data visualizations easy
A 2013 DataCamp survey on R in education showed that 71.1% of the respondents were in economics or business studies while only 10.5% were in computer science, showing that data literacy and skills matter across the board.
Data Science
Alongside Python, R is an important language in the world of data science. With the help of R, professionals can model and analyze both structured and unstructured data, they can also use R to create machine learning and statistical analysis tools that assist in their work.
R makes handling data from various sources easy, from import to analysis. Plus the R system itself and the CRAN library offer plenty of data visualization functions and tools, which makes it easy for professionals to present their research and findings in an impactful and easy-to-read format.
Statistics
It goes without saying since it’s a statistical programming language, but R is the go-to for statistics and statistical computing—after all, it was designed by statisticians for this purpose.
A broad range of packages supports work in this field, while the R language itself can be used to develop software tools that include statistical functions. Its use may even go further. In an interview, RStudio computer scientist Joe Cheng notes that R can be used as a general-purpose language to implement new statistical languages.
Finance
With its flexibility and aptitude for any data analysis task, it’s not surprising that R has found increased use in finance. Companies such as ANZ and Bank of America use the language for credit risk analysis and modeling, financial reporting, handling investment portfolios, and numerous other tasks.
Dedicated tools such as jrvFinance and the bundle package Rmetrics allow those working in finance to perform financial computations, even if they have limited programming experience.
DataCamp offers a range of R for finance courses, including Finance Fundamentals in R, and Applied Finance in R.
Social Media
Since its early days of Open Dairy and Bolt, social media has grown its reach from a few tech-savvy users to practically everyone who owns a smartphone. These days, it’s hard to find someone who uses no social media platforms.
Social media is also big business, a business that primarily trades in data. Companies such as Meta (Facebook and Instagram) and TikTok rely on users’ habits to offer targeted advertising to other companies.
Every single thing you do or interact with on social media generates data that can be used for this purpose, and tools such as R are the perfect way for social media companies to extract insights from the mass amounts of data they collect and manage the algorithms that keep users coming back for content that suits their interests.
Which companies use R?
Here are just a few of the big-name companies that use R in their tech stack:
- Bank of America
- Amazon
- JP Morgan
- Accenture
- IBM
- Uber
- Deloitte
- The New York Times
- Ford
- HP
- And many more…
Some Code Examples
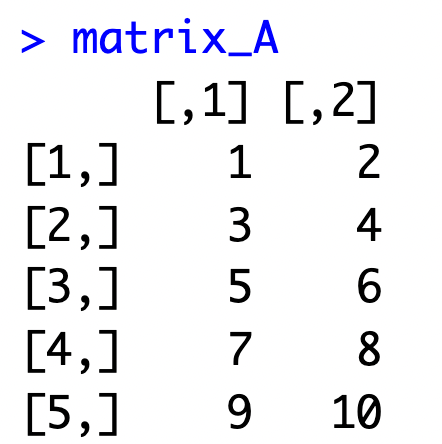
R can perform basic code like creating a matrix and its manipulation as we can see below:
#Let’s create a matrix matrix_A <- matrix(1:10,nrow = 5, byrow = TRUE) matrix_A
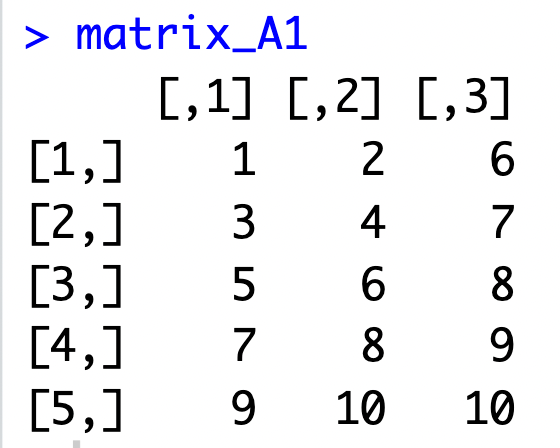
#Now let’s add a column to the matrix matrix_A1 <- cbind(matrix_A,c(6:10)) matrix_A1
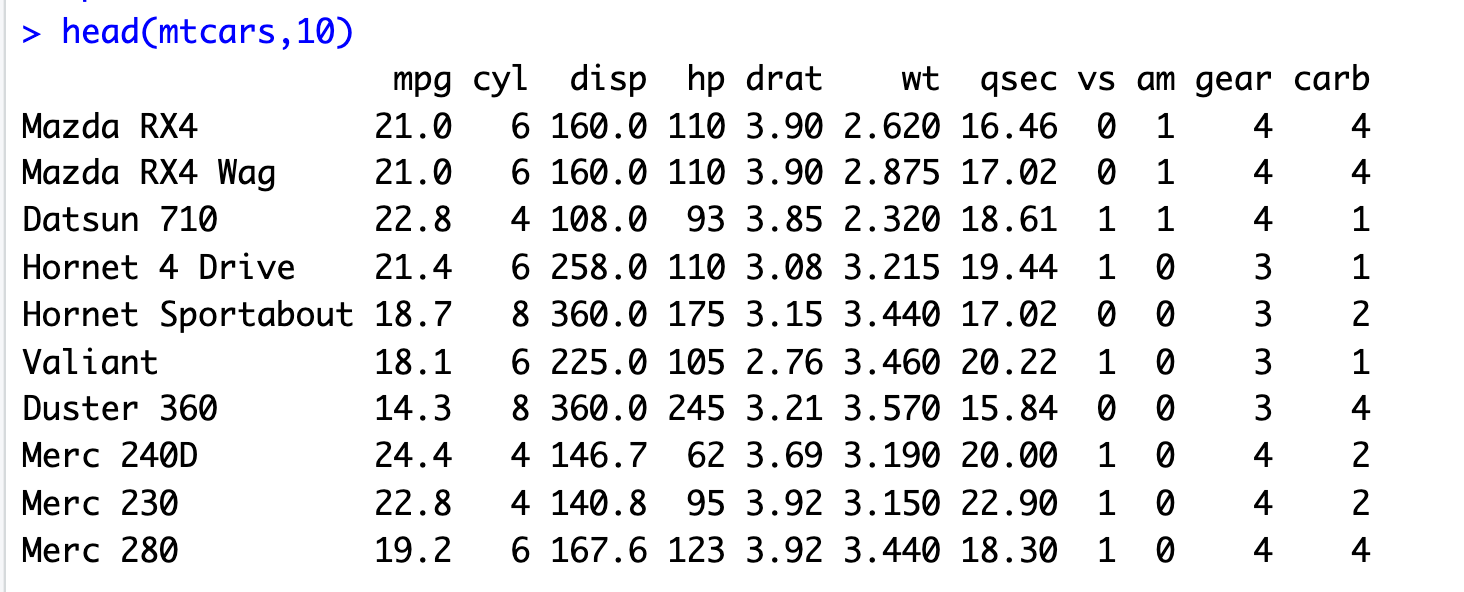
It can also help with data analysis and manipulation:
#Let's load a built-in dataset data(mtcars) #print first 10 rows head(mtcars,10)
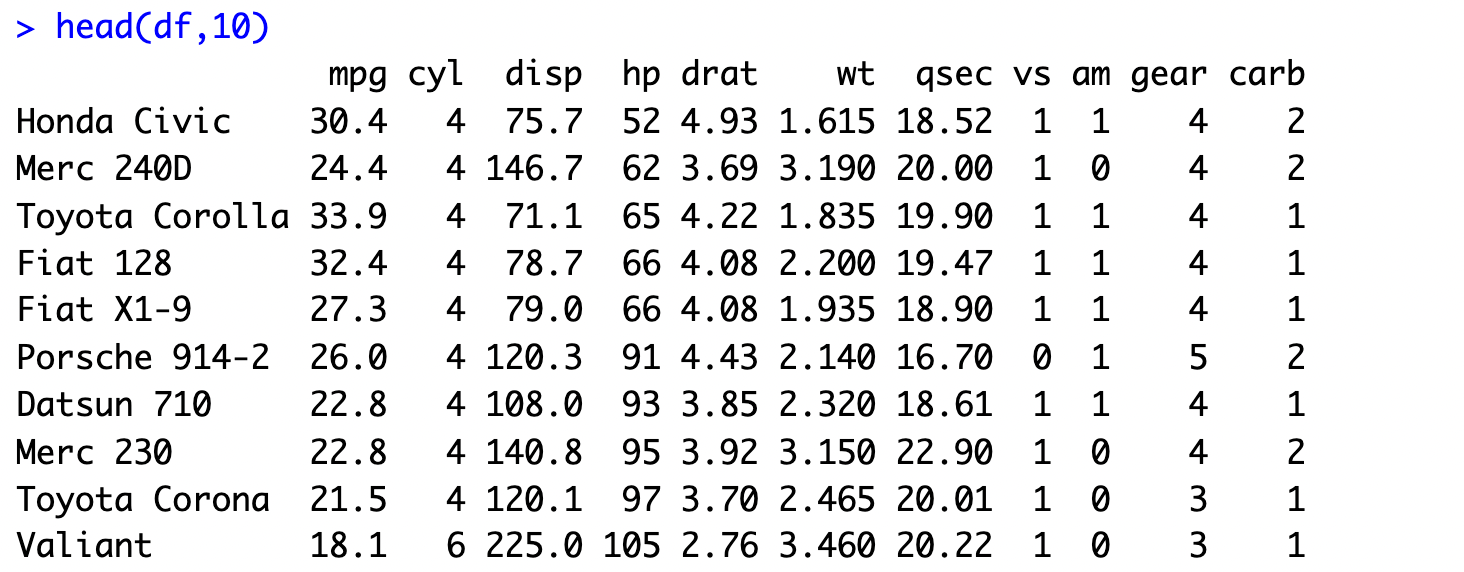
#Let us try to sort the dataset based on ascending order of horsepower attach(mtcars) df<- mtcars[order(hp),] head(df,10)
R Basics and Advanced R
People with basic R knowledge can use the programming language to perform basic data sorting and analysis tasks, such as assigning variables and using the command line to perform calculations.
They can also produce visual representations of data such as pie charts or graphs. They might even use R to help them manage their own personal finances or those of a small company.
As expected, people with advanced knowledge of R can do all these things and many more besides.
R’s use extends past creating visualizations and data analysis. Because it’s a powerful statistical computing tool, R can be used to build predictive machine learning models and other data science tools.
Although it’s primarily a functional and domain-specific language, R can even be used for some object-oriented programming tasks. Experts may also use R for metaprogramming, the creation of programs that can then write or manipulate other programs.
Whether you’d just like a tool to better manage your own spending habits or you want to become a master of the R code, DataCamp can help. Our broad range of R courses and career tracks are suitable for everyone, from absolute R beginner to competent R programmer and beyond.
Rounding Up R
R is a popular programming language that allows people to adeptly handle mass amounts of data, generate publication-quality visualizations, and perform a range of statistical and analytic computing tasks.
Used in fields including data science, finance, academia, and more, R is powerful, flexible, and extensible. It’s also free and completely open-source, which means there are plenty of packages available to help R users with all manner of tasks and a supportive community of R lovers worldwide.
If you’re interested in a career in data, R skills can help you get ahead—and land a well-paid job in data science. DataCamp is home to the internet’s most comprehensive range of R courses. From introductory level all the way up to machine learning with R, we have you covered.


No comments: