How to Use of Color - photography guide for beginners

December 23, 2021


How to Use of Color - photography guide for beginners


How to Use of Color - photography guide for beginners


Color has such a monumental significance in photography that it’s strange to think that color photography only became more popular than black and white in the 1970s. Since then the world of colors has introduced a whole new axis of interpretation to photography, and exploring color theory has become invaluable for every designer and photographer. In this comprehensive guide, we’ve accumulated everything you need to enhance your understanding of color in photography. Let’s follow the rainbow.

Colorize Images Instantly With Picsart

Colorize your basic images and turn them into your favorite hues in a single click with Picsart’s color effects and filters.Colorize Your Image
How to Use of Color - photography guide for beginners

What is Color?

How to Use of Color - photography guide for beginners

Visually, color is associated by the measurement of three properties: hue, brightness (or luminance), and saturation.

  • Hue

A hue is the general definition of a color. It’s how we perceive, recognize that a color is red, blue, green, etc. A hue includes all gradations of a color, from its lightest tint to its darkest.

  • Value

Value is also known as luminance or brightness. It ranges from 0 (black) to 100 (white) and determines how light a color is.

  • Saturation

Saturation also ranges from 0 to 100 and determines how intense or pure a color is. Low saturation means a color is close to grayscale.

Camera vs. The Human Eye | what is the Difference

Camera vs. The Human Eye | what is the Difference

It is said that the design of the first camera was inspired by the human eye, but still there is a remarkable difference - how the human eye perceives colors and how a camera does. 

A camera’s sensor captures light as it is, while the brain is constantly in the process of modifying light and interpreting an image information according to its own.

That’s why some people saw the dress that went viral a couple of years ago as blue and black, while others saw it as white and gold: color perception is processed on the information filled in by the brain according to its previous experiences. 

A digital camera, working on pixels, uses thousands of light cavities to capture and then assess the electrical signals which measure the strength of the captured photons for any given pixel.

Need to understand the Colors

To improve the use of colors and understanding of color in photography, we need to get familiar with the color system and organisation of colors:

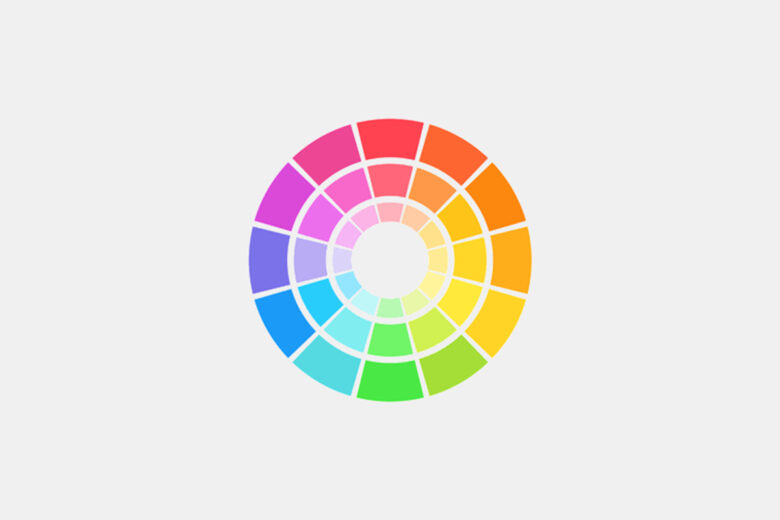
    • Check this Wheel of colorsWheel of colors

The color wheel is one of the most popular ways of organizing colors and theorizing about them. It is a way to demonstrate the relationship between primary, secondary, and tertiary colors geometrically. 

The color wheel is also useful in figuring out classical color combinations often used in designs. You can read more about the color wheel and color theory in this article.

  • which are Primary Colors ?

    Primary Colors

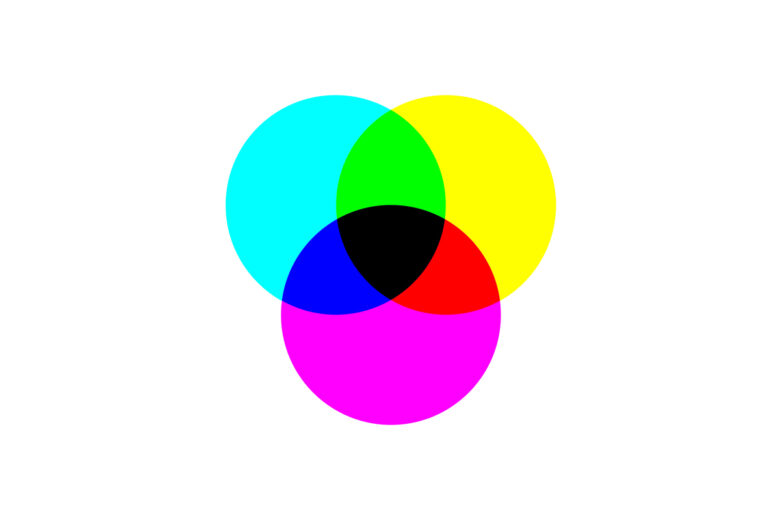
The three primary colors in the RGB color model are red, green, and blue. On the color wheel, the primary colors divide the circle into three equal parts.

  •  what are Secondary Colors ?Secondary Colors

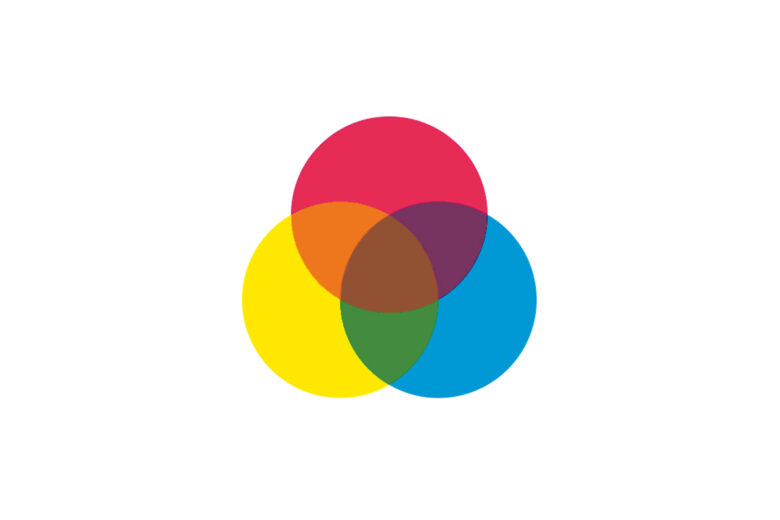
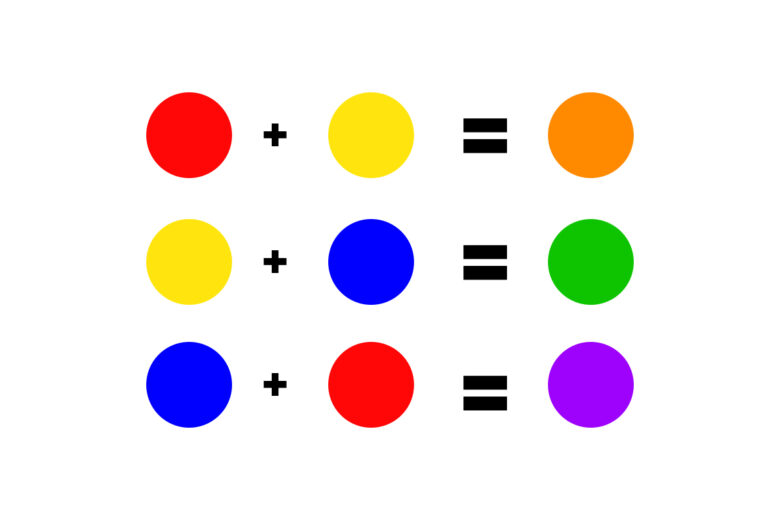
Secondary colors – magenta, cyan, and yellow – are the colors you’ll get if you mix two primary colors in equal measure. For example, mixing together blue and green will result in cyan. Thus, cyan is equally distanced from blue and green on the color wheel.

  • Tertiary Colors

    Tertiary Colors

Tertiary colors are what you get when you mix a primary color with a secondary color close to it on the wheel. They are rose (red-magenta), azure (blue-cyan), red-yellow (orange), green-yellow (chartreuse), blue-magenta (violet), green-cyan (spring green).

Different Color Schemes

Most designs start with a selected color scheme, and here the color wheel offers some tried and tested combinations. The most common three are monochromatic, analogous, and complementary, but of course, you can expand your horizons later.

  • Monochromatic

    Monochromatic colors

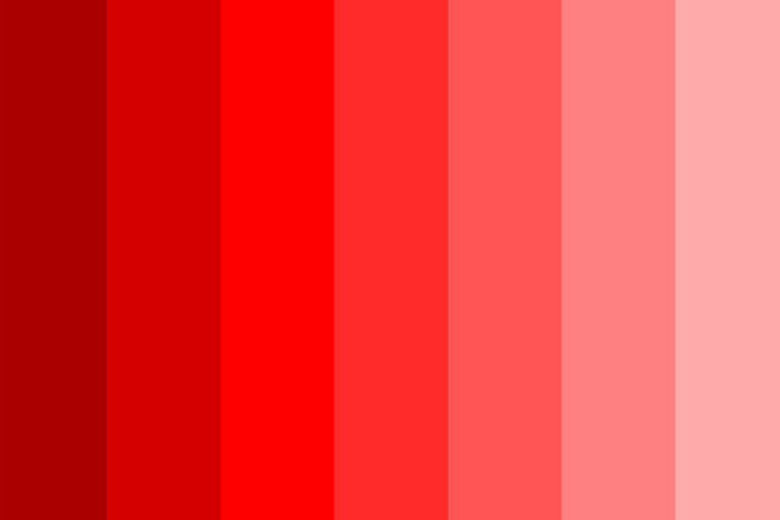
There are few color palettes as easy to work with as monochromes. A monochromatic palette is essentially a palette of one hue. It includes some of the shades and tints of a single hue.

  • Analogous

    Analogous

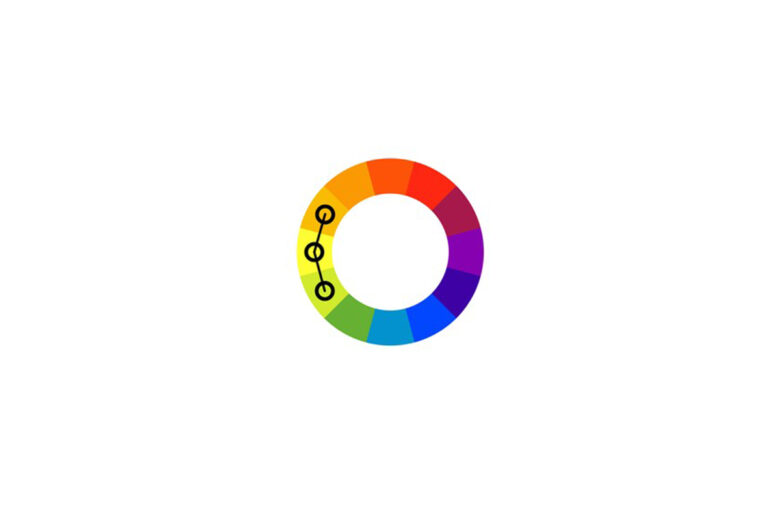
An analogous color scheme is made up of three colors that are next to each other on the color wheel. For example, you can take red, red-orange, and orange. 

Analogous palettes are famous for their harmonious and pleasant look. Generally, a designer or photographer will pick one dominant color and use the other two as complements.

  • Complementary colors

    Complementary colors

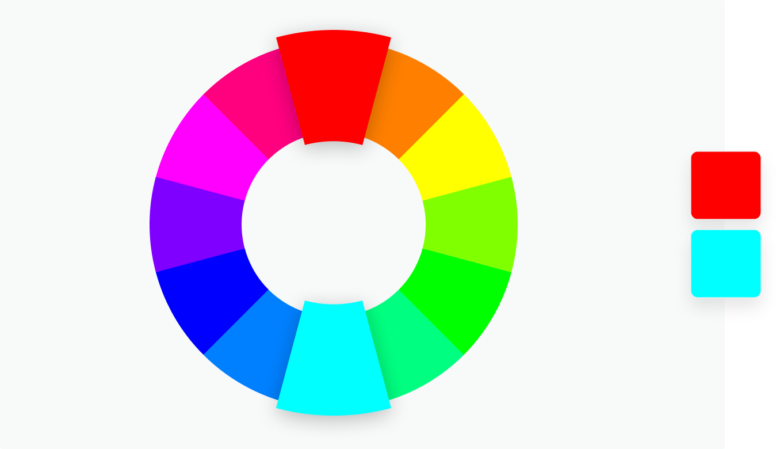
Complementary color schemes demonstrate the old adage of opposites attracting. Well, here opposites on the color wheel complement each other, thriving off of the tension they create and inviting the viewer to really notice and appreciate the use of color in photography or design.

 What is the Psychology of Colors?Psychology of Color

In part, the meanings of color are shaped by localized cultural norms and social influences, but you can’t deny the direct and universal influence some colors have on the human psyche. 

To truly master color photography, you should delve deep into the emotional meanings of different colors.

The general rule is that warm or dominant colors (orange, red, and yellow) evoke and inspire passion and enthusiasm, and symbolize positivity, strength, and intensity. On the other hand, cold colors (greens, blues, purples) soothe and calm, symbolizing reason, quiet, and contemplation.

For a more in-depth understanding of color in photography, here are the key meanings of each color:

White: A neutral color that stands for openness, cleanliness, serenity, innocence, and clarity. White is a color that is present in almost any photo.

Black: Another versatile neutral with many meanings. Black is mysterious, elegant, powerful, and formal. Some of its darker meanings are grief, death, and evil.

Gray: Gray is a refined, if somewhat conservative, neutral that combines really well with the warmer colors. It communicates balance and steadiness.

Red: The loudest color in all of color psychology, red symbolizes passion, vitality, pain, love, and vigor. It is, of course, the color of anger, blood, and courage.

Pink: Pink is all about youthfulness, femininity, innocence, and tenderness. A lot of people find comfort and kindness in pink.

Blue: Blue is most people’s favorite color. It stands for peacefulness, dreaminess, relaxation, and order.

Green: Nature’s favorite color, green is associated with vitality, renewal, tranquility, and generosity.

Orange: Orange is the color of creativity, energy, warmth, and playfulness.

Yellow: Yellow is the color of optimism, childlike curiosity, zeal, and light-heartedness.

Brown: Reliable and safe, brown symbolizes honesty, resilience, loyalty, and growth.

Purple: Eclectic and multi-faceted, purple stands for magnanimity, nobility, originality, and spirituality.

How The Smoothie Diet™ 21 Day Weight Loss Program can help you?

December 06, 2021


 How The Smoothie Diet™ 21 Day Weight Loss Program can help you?

go.smoothiediet

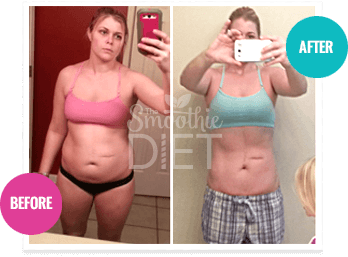
THE SMOOTHIE DIET is a revolutionary new life-transformation system that not only guarantees to help you lose weight and feel better than you have in years, it also promises to eliminate more body fat - faster than anything you’ve tried before.


21 DAYS

TO A SLIMMER, SEXIER YOU!

WHAT MAKES THE SMOOTHIE DIET DIFFERENT?

This Is NOT just a big book of smoothie recipes. You're getting the same proven 3-Week weight loss and health improvement program I share with my private clients. The secret that makes the Smoothie Diet so effective is the Custom 3-Week Weight Loss Schedule. All the smoothies are given in a very specific sequence and frequency to maximize your results. For example the nutrient and ingredient ratios vary week to week to make sure the weight keeps coming off and stays off.


What will you get in THE SMOOTHIE DIET 21-DAY PROGRAM ?


If you're looking for a complete life transformation over the next 3 weeks then you’re in the right place! Whether you need to lose the last 5-10 lbs or you want to get rid of 40lbs or more, this will work for you. This diet is extremely flexible so even though this program is 21 days you can continue using it for as along as you want to lose as much weight as you want and I explain exactly how.

Dramatic weight loss is only one of the numerous benefits you’ll get from this diet. How would you like more energy, clearer skin, better sleep, sharper thinking, stabilized blood sugar, and more? You are only 21 days away...


you will get 


  • --You're getting the FULL 21-DAY WEIGHT LOSS AND HEALTH IMPROVEMENT PROGRAM I regularly use with my private coaching clients.
  • --Over 36 DELICIOUS FAT-MELTING MEAL-REPLACEMENT SMOOTHIE RECIPES
  • --SHOPPING LISTS FOR EACH WEEK To Make It Super Simple To Get Everything You Need
  • --SMOOTHIE MAKING TIPS & PREP GUIDE To Make Sure there is ZERO trial and error and to ensure you spend less time in the kitchen and more time enjoying your new confidence and energy levels!
And much more Bonuses !!  ( check here )


All of your confusing Questions are answered below! 

I need to lose more weight, how do I continue after the 21 days?

The best part of The Smoothie Diet is that you can use it for as long as you need, to lose as much weight as you want. I make it super simple to continue using everything you learn in the first 3 weeks to extend the program for the next few weeks or even months. And each additional week will be just as enjoyable as the first three! My goal is to give you all the tools you need to continue losing weight and getting healthy for as long as you need to.

Won't I just gain all the weight back?

Unlike other diets, this is not a “quick-fix”. 21 days is only the beginning to a lifetime of better health and a slimmer body. The #1 comment I get on The Smoothie Diet is that after a few weeks, the cravings for sweets and junk foods have essentially disappeared. This makes it very easy to keep the weight off. I also show you exactly how to transition back into your regular eating patterns after the 21 days while still incorporating smoothies into your diet to keep the weight off. In fact, most people love the smoothies so much they don’t want to give them up after the 21 days! As some of my clients have said, this is a complete life-transformation program.

I have type-2 diabetes, will this work for me?

Fresh, whole fruits, as well as blended green smoothies not only provide a healthy way for diabetics to get more fruits and vegetables in their diet, green smoothies also may help reverse some of the diet and lifestyle problems that exacerbate diabetes, or contributes to its progression. The great thing about the Smoothie Diet is that it kicks off a chain-reaction of lifestyle changes that reduce or eliminate the factors that exacerbate the disease, and reverses the condition in some individuals. Please note that while I am a nutrition expert, I am not a doctor. If you have diabetes or ANY other health condition, you should always consults with your doctor first before making any dietary changes.

I don't have a lot of time in the day, is this hard to follow?

If you don’t have a lot of time in the day, then this program is PERFECT for you. My ideal customer is a busy mom who works, goes to school, has errands to run, kids to drop off/pick up, etc. I designed this program to be super simple and take minutes a day. I even provide tips on how to cut corners to shave some valuable extra minutes off your smoothie prep. The recipes are quick to make and you can either enjoy them right after you make them or take them with you. You’ll always have a delicious, filling meal with you. And if you can press one button on your blender then you can follow this program :)

Do I need an expensive blender or are the ingredients hard to find?

With the increased popularity of smoothies, blender prices have gotten very competitive. The most important thing is to have a blender with a strong motor. While the bender you have now will probably work just fine, If you are serious about making a big change in your health, then I show you some of the top-of-the-line blenders. But I also show you cheaper models that will work just fine and are under $50. The ingredients are not hard to find and if they are, I provide a full “Swap List” that shows you easy substitutes to use if you can’t find something.

Is there anything that comes in the mail?

This is a fully digital product. You will not receive anything in the mail. The great thing about this is that you will have access to it in minutes. You don't have to wait for anything to arrive on your doorstep. I want to harness the excitement you're feeling right now and get you started right away. You can even do your week 1 shopping today and start tomorrow…or start today! The files are in PDF format. After you checkout, you will automatically be taken to a page where you can download and view everything on your computer, tablet, or smartphone. For those of you who would prefer a printed book, the Quickstart Bonus is designed for this. It is a 20-page shortened version of the main guide that can be printed out and followed just like a printed book.

What if it doesn't work for me?

If for some reason this program does not work for you even though you have followed it exactly as I have laid out, I have no problem giving you a full refund. I'll even cover you for a full 60 days so if you are unhappy for any reason over the next 2 months, you get your money back. If you are not happy with the program, then I don’t want you to have to pay for it. I believe in building relationships with my customers and your satisfaction is my #1 priority.

Still Have Questions? I've got you covered! ( check here more..)


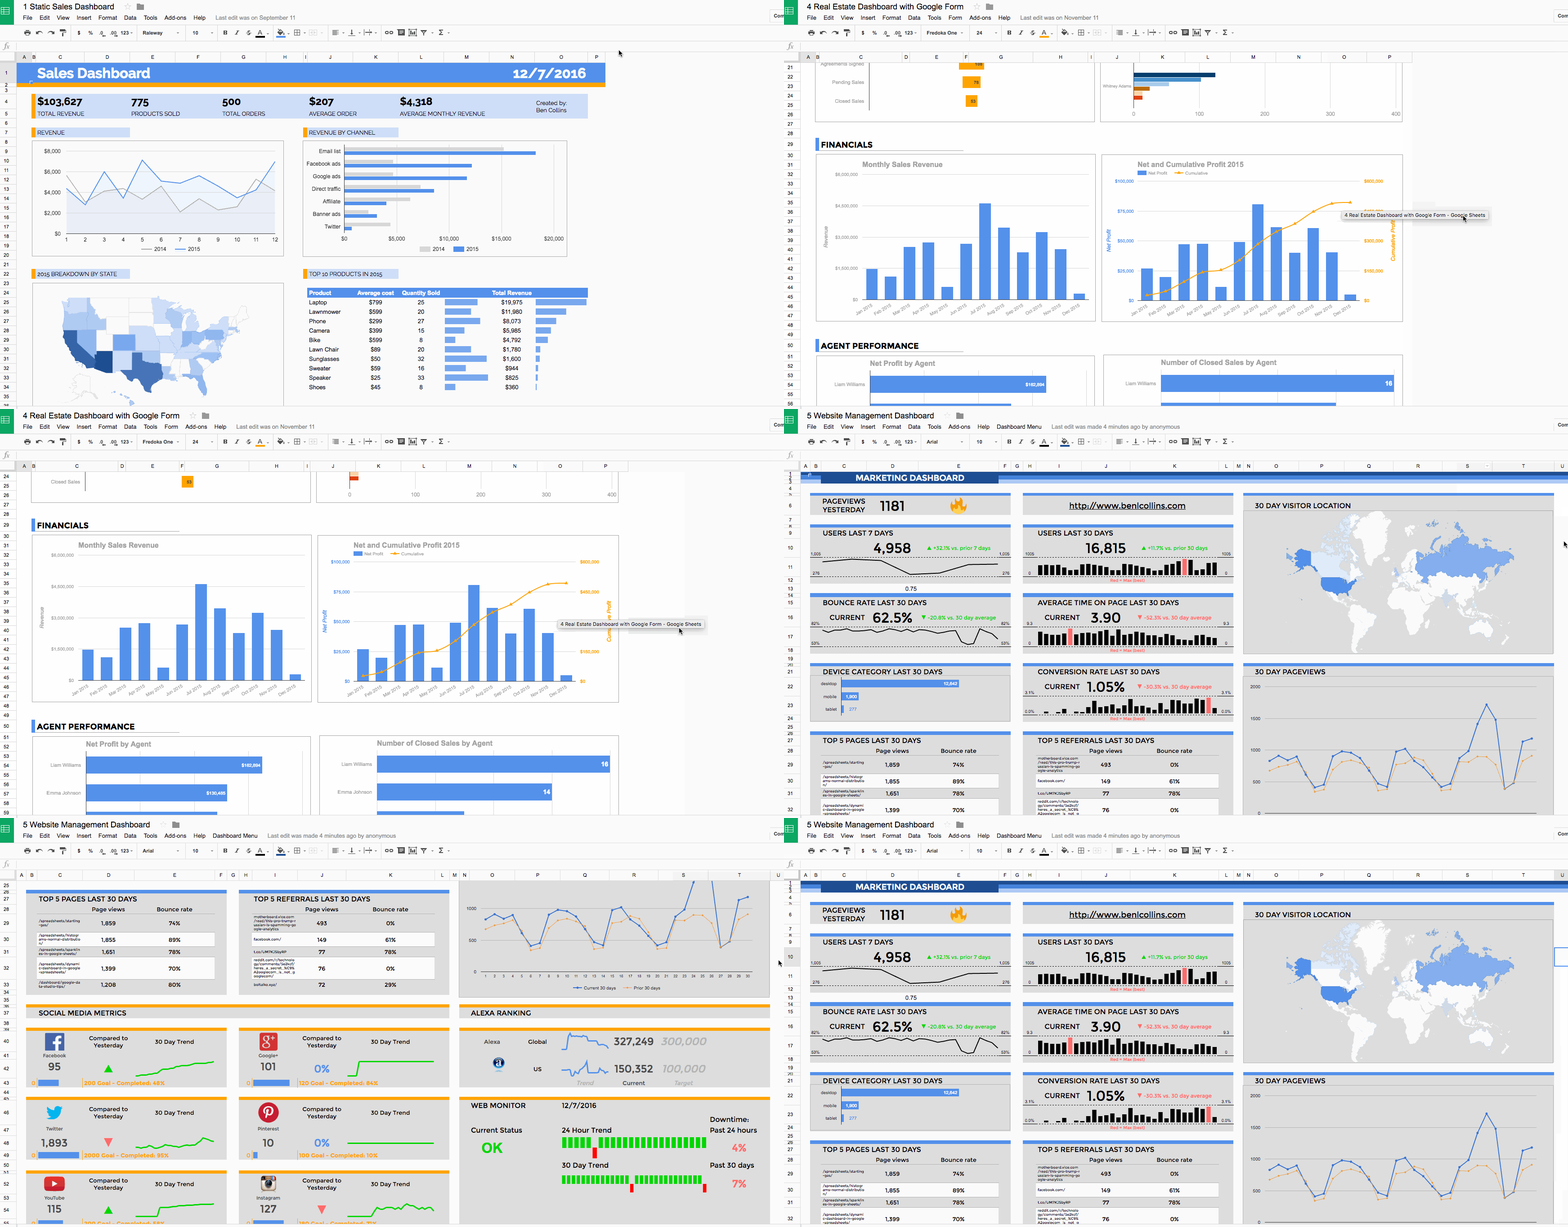
How to Build Dashboards With Google Sheets?

December 06, 2021


How to Build Dashboards With Google Sheets?


Build Dashboards With Google Sheets

Learn how to create interactive dashboards in Google Sheets and take your career to the next level.

  • Actionable, bite-size video lessons that walk you step-by-step through techniques
  • Access to the finished dashboard templates and raw data files, which you can copy as many times as you like
  • Access to the private course Facebook group for Q&A
  • Mobile and tablet friendly


Your Outcome

You’ll learn how to create business dashboards using google sheets to track important KPIs for your business.

Do you spend hours collecting data, wrestling it into the format you need and then updating the same report that no one ever reads?

‍Or maybe you’re neck deep in data but don’t know how to use it to make sound business and marketing decisions?

Dashboards give you a high-level overview of your business, showing KPIs, trends and data comparisons… so you can use that insight to grow in smart ways.

‍By learning some relatively simple techniques, you can create dashboards that are automated, interactive and visually appealing.


‍This course will set you up to:‍

  • Have the confidence to build your own dashboards with your own datasets
  • Know what to include in your dashboards to maximize their impact
  • Have the technical skills to manage advanced dashboard projects without feeling overwhelmed
  • Create interactive dashboards, so colleagues and clients can view the data they want to see
  • Understand and use best practices in Google Sheets, to avoid making the same mistakes I made
  • Be confident using advanced formulas and pivot tables
  • Use Apps Script to automate processes and make your dashboards work for you!‍

Each lesson is taught through bite-sized, action-oriented 5–10 minute-long videos, covering practical techniques you can apply to your own business.‍

I’ll be with you every step of the way, showing you the sheet setup, the formulas and the charts we use.‍

For each example you’ll have all the necessary raw data and formulas, as well as a final, finished template!‍

I’ve made just about every mistake in the book

Prior to consulting and creating courses, I worked as a forensic accountant, doing investigations into sanctions violations at large financial organizations.I remember the first time I built a dashboard in Excel at work.

‍After a lot of headaches and frustration, I had created a presentable dashboard that gave our team oversight of whole dataset.

‍The dashboard wasn’t pretty, and it probably violated dashboard best principles, but it worked. It was dynamic and I clearly remember how cool that was.

‍However, I had no idea what I was doing. I barely even knew what dashboards were, and I certainly didn’t know there were courses and books out there that could have saved me hours and hours (and resulted in a better end product!).

Seeing the team interact with the dashboard, I realized how valuable solid data and spreadsheet skills were — something we address throughout this course.

Fast forward to today

Today I create online courses and write about working with data, with a particular focus on how-to articles for learning data analytics and building dashboards, using Google Sheets, Apps Script and Data Studio.

‍Since mid-2015, I’ve been working as a freelance spreadsheet developer, data consultant and instructor.

‍I’ve taught data analysis and visualization courses and workshops at General Assembly’s Washington, D.C., campus and privately for clients.


‍What are dashboards?

‍Dashboards are high-level summaries of your organization’s data, displayed side-by-side in a single page to highlight the key metrics and trends at a glance. They’ll help you:‍

  • Quickly understand the pulse of your business
  • Visually summarize key metrics for stakeholders who don’t have time to review the data
  • See new insights with your data side-by-side
  • Explore the data with interactive features
  • Speed up and automate your reporting pipeline‍

Here’s how you might use dashboards:‍

  • Show growth of your website or clients’ websites, by tracking traffic and social media metrics over time.
  • Understand your business better by collecting and analyzing user data in real-time.
  • Compare sales data across different time periods, sales channels or geographic regions to get deeper insights into your opportunities.
  • Measure student attendance and performance to easily see where to allocate resources.
  • Track and visualize financial data to uncover high- and low-performxing areas of your company, so you can make adjustments going forward.‍

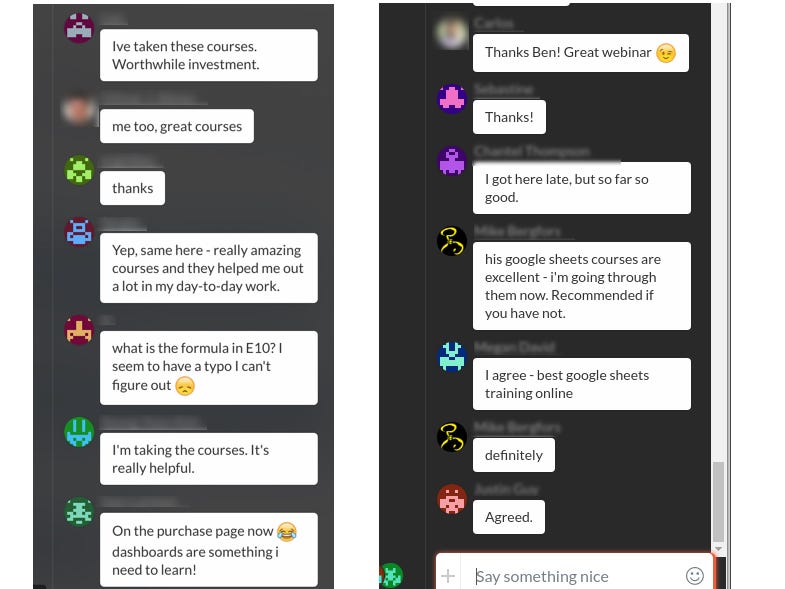
Earlier this year I ran a couple of webinars, and here’s what some folks were saying about this Google Sheets dashboard training course:‍

‍Who is this course for?‍

  • Anyone who works with data in Google Sheets.
  • Someone who is curious to learn more about Google Sheets and dashboards.
  • Maybe you’re a data analyst, a technical marketer, an educator, a scientist or someone in between.
  • Anyone who wants to add new a skill, building dashboards, that will help you advance your career.


Chapter 1: Course Introduction

  • Lesson 1: Introduction (3:28)
  • Lesson 2: About the Author (2:20)
  • Lesson 3: How is this course structured? (1:22)
  • Lesson 4: Why use Google Sheets to build your dashboards? (4:25)
  • Lesson 5: What is a dashboard? (6:28)
  • Google Sheets Chart Tool Update (3:13)
  • Join the course Facebook Group

Chapter 2: Static Sales Dashboard

  • Lesson 6: Introduction to the Static Sales Dashboard (1:20)
  • Lesson 7: The raw data (8:34)
  • Lesson 8: Setting up the Summary Data Table (4:00)
  • Lesson 9: Introduction to Pivot Tables (7:56)
  • Lesson 10: Creating the Revenue Chart (2:19)
  • Lesson 11: Using Pivot Tables to breakdown Sales by Channel (5:21)
  • Lesson 12: Creating the Sales Channel Chart (2:04)
  • Lesson 13: More pivot table practice! (4:27)
  • Lesson 14: Creating a Geographic chart to show sales by US State (3:18)
  • Lesson 15: Advanced features of pivot tables to find the Top 10 products (4:54)
  • Lesson 16: Building our Sales Dashboard Part 1 (9:46)
  • Lesson 17: Building our Sales Dashboard Part 2 (2:30)
  • Lesson 18: Building our Sales Dashboard Part 3 (9:13)
  • Lesson 19: Building our Sales Dashboard Part 4 (3:39)
  • Lesson 20: Sharing your dashboard (9:21)

Chapter 3: Dynamic dashboards

  • Lesson 21: Interactive dashboard introduction (1:38)
  • Lesson 22: The raw data for the interactive dashboard (4:56)
  • Lesson 23: Named ranges in Google Sheets (alternative method to lesson 23) (4:38)
  • Lesson 24: Interactive dashboard data validation (4:57)
  • Lesson 25: Interactive dashboard staging tables 1 (10:24)
  • Lesson 26: Interactive dashboard staging tables 2 (10:59)
  • Lesson 27: Dynamic charts (4:42)
  • Lesson 28: Interactive dashboard build 1 (15:24)
  • Lesson 29: Interactive dashboard build 2 (6:27)

Chapter 4: Dynamic Sales Dashboard

  • Lesson 30: Dynamic sales dashboard introduction (1:17)
  • Lesson 31: Interactive sales data validation (3:00)
  • Lesson 32: Dynamic Key Performance Indicators (4:19)
  • Lesson 33: Dynamic revenue table and chart (5:33)
  • Lesson 34: Dynamic sales channel chart (3:22)
  • Lesson 35: Dynamic sales geographic chart (4:58)
  • Lesson 36: Dynamic Top 10 table (9:16)
  • Lesson 37: Interactive sales dashboard final build (6:44)

Chapter 5: Real Estate dashboard using Google Forms

  • Lesson 38: Real estate dashboard introduction (3:42)
  • Lesson 39: Real estate dashboard raw data (2:20)
  • Lesson 40: Using Google Forms to collect data (8:42)
  • Lesson 41: Real estate sales funnel chart (7:42)
  • Lesson 42: Agent Performance stacked bar chart (6:36)
  • Lesson 43: Real estate financial charts (11:38)
  • Lesson 44: Real estate detailed agent breakdown charts (10:13)
  • Lesson 45: Real estate dashboard build 1 (11:59)
  • Lesson 46: Real estate dashboard build 2 (6:08)

Chapter 6: Digital marketing dashboard

  • Lesson 47: Digital marketing dashboard introduction (5:17)
  • Lesson 48: Creating a dashboard settings tab (5:49)
  • Lesson 49: Introducing the Google Analytics add-on (4:49)
  • Lesson 50: Advanced use of the Google Analytics add-on (14:18)
  • Lesson 51: Data staging part 1 (14:11)
  • Lesson 52: Data staging part 2 (15:16)
  • Lesson 53: Dashboard panels and sparklines for our Digital Marketing dashboard (15:10)
  • Lesson 54: Adding charts to our Digital marketing dashboard (9:12)
  • Lesson 55: Alternative sparkline chart (4:31)
  • Lesson 56: Advanced formulas to add context to our Digital marketing dashboard (7:27)
  • Lesson 57: Add comparison formulas for analysis to our Digital Marketing dashboard (19:13)
  • Lesson 58: Format the Digital Marketing dashboard to make it look professional (5:57)
  • Lesson 59: Fire emoji bonus! (5:45)


Chapter 7: Adding social metrics and customizing web dashboard with Apps Script

  • Lesson 60: Introduction to the Social Media metrics and Apps Script dashboard tricks (2:36)
  • Lesson 61: Import formulas to scrape social media data (12:10)
  • Lesson 62: Import formulas to scrape Alexa web ranking data (6:02)
  • Lesson 63: Introduction to the Apps Script language (11:28)
  • Lesson 64: Use Apps Script to save copy of social media data (10:49)
  • Lesson 65: Build social media panels in our dashboard (21:57)
  • Lesson 66: Build the Alexa web ranking panel in our dashboard (5:36)
  • Lesson 67: Add a website uptime monitor to our dashboard (13:39)
  • Lesson 68: Add themes to our dashboard with Apps Script (5:33)
  • Lesson 69: Automatically distribute dashboards via email using Apps Script (5:02)
  • Lesson 70: Set up triggers to run our dashboard automatically (5:48)

Chapter 8: Data Studio

  • Lesson 71: Introduction to Google Data Studio (8:33)
  • Lesson 72: The basics of Data Studio (20:28)
  • Lesson 73: Control data using filters in Data Studio (6:59)
  • Lesson 74: Data Sources and Calculated Fields in Data Studio (12:42)
  • Lesson 75: Mobile Reporting dashboard example in Data Studio (15:33)

Teachable Best Price Guarantee™

If you find it cheaper anywhere else, we’ll refund you the difference.

30 Day Money Back Guarantee


ads 728x90 B
Powered by Blogger.